Technical analysis is a mix of science and art. As a new crypto trader, you might be looking at charts with a sense of wonder and bewilderment.
I’ve written an overview of technical analysis basics here.
In keeping with the theme of simplicity, we’ll look at some easy technical concepts, what they mean and how you can use them.
In this piece, we’ll explore support and resistance lines. This will be the quick and dirty method to show you what to look for. Technical purists may want to refer to the books in the previous article for a more precise approach.
Support and resistance lines are very simple tools that you can use to plan trades and develop risk management strategies. These two tools are information-rich for traders in competitive markets like Bitcoin, Ether and others.
As always, I want to make clear that this isn’t financial or trading advice. All of the material on the site is to help you think differently about the crypto market. It is up to you to integrate what you learn in a way that suits your approach best.
Now, the first thing we want to emphasize is what technical analysis is and why it works.
Technical analysis for crypto is about an evolving story
Technical analysis is often described as a way to predict the future. Sometimes it’s referred to as a map. The beauty of a chart is that it is open to a wide range of interpretations.
Each point on the chart reflects real-world buying and selling by participants.
But does the chart predict the future?
I would argue that charts are a story of beliefs about an asset in time that reflect a view about the future.
A chart is a depiction of a competition between beliefs and narratives about an asset.
Those beliefs and narratives are expressed through buying, selling and hedging.
This competition creates a picture of potential opportunities. Those opportunities have a risk associated with them. And by using technical analysis, you can define roughly what reward you expect and the risk to achieve that.
So think of a chart as more of a story about beliefs about the asset than a prediction tool.
Your job is to figure out how to profit from the unfolding story.
A big part of crypto charts is psychological
When it comes to the story you are interpreting on the chart, there is another factor to consider.
How many other people believe the same story?
Technical analysis works best when more people believe in it and use it. The more people look at the chart and see a certain story unfolding, the more likely it will happen.
So part of your technical analysis skill development is figuring out what story most market participants believe.
Is crypto going higher because the chart looks like this, or is it a fakeout?
Is Bitcoin topping out, going sideways, and why?
Is this selloff going to stop here and why?
What is the story the majority of people believe?
Another thing about the charts is that crypto traders will start to anticipate how that story will play out over time. They will position ahead of the outcome they believe will take place.
This is why it’s said to be a predictive tool.
You will see this when trading patterns change. When a new pattern unfolds, it may work for a period of time. More traders will recognize the pattern and participate in it. As traders anticipate and position, that pattern will become efficient and unprofitable.
All of these elements are important to keep in mind as you look at the charts. Because the patterns you see aren’t static, they are constantly evolving stories about future expectations.
Support and resistance lines are simple technical tools
Support and resistance lines are a simple tool for looking at any market. These lines represent an imaginary place where the majority of participants believe something will happen.
They believe that because the story they see shows them that it has happened before.
And therefore, it’s not unreasonable to think that something similar will occur again in the future.
I refer to them as imaginary because you choose where you see them on the chart.
How do you do that?
Pick a line through a place where obvious activity changes take place. Pick several if you like, then look at the activity associated with that price.
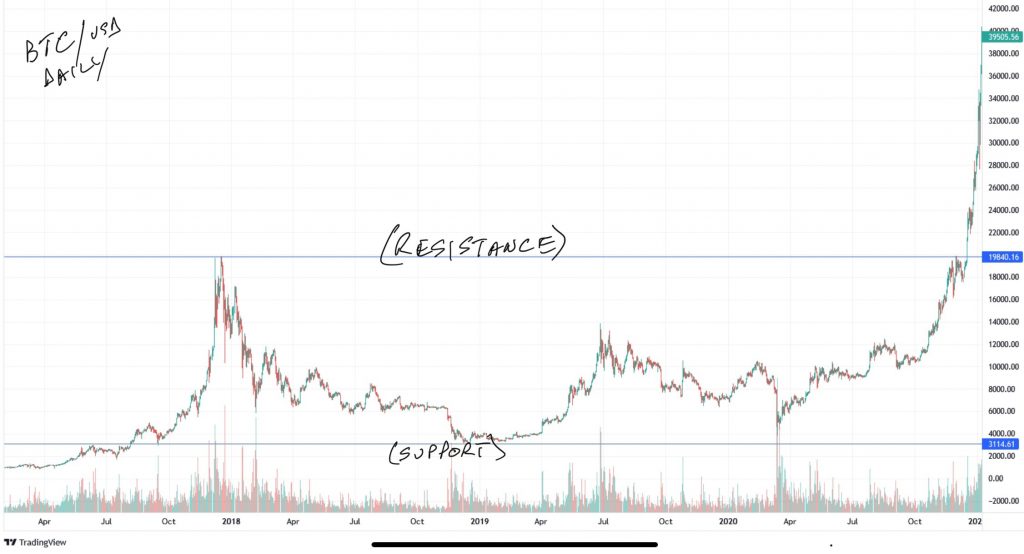
Support and resistance lines can help you see where a cryptocurrency like BTC might stop rising or declining.
These technical indicators can help you anticipate and recognize changes in sentiment represented by breakouts and breakdowns.
Breakdowns violate support and can turn it into resistance, a bearish sentiment.
For resistance, breakouts signal a bullish trend where violation of resistance becomes support.
These can also be used as key parts of a trading plan and risk management tool.
So if you plan to trade around these points, how can you use them to your advantage while protecting your downside?
Now, the next concept to think about is the timeframe.
Use a variety of timeframes with your technical indicators
Depending on what kind of a trader you are, you will have a different timeframe. A crypto day trader will have a different activity level and focus compared to a crypto swing trader.
However, it’s always a good idea to have the bigger picture in mind.
Look beyond your trading timeframe and see the longer-term perspective.
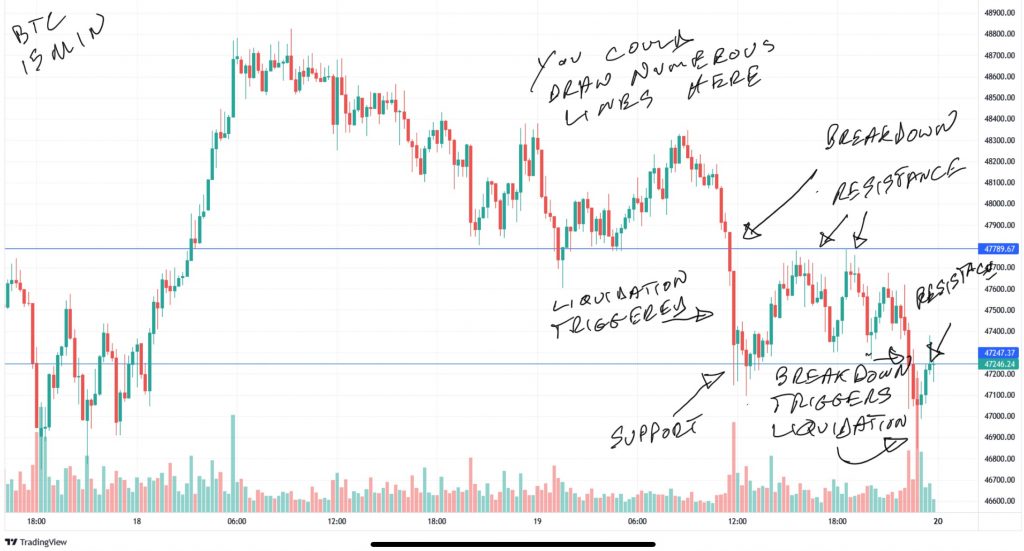
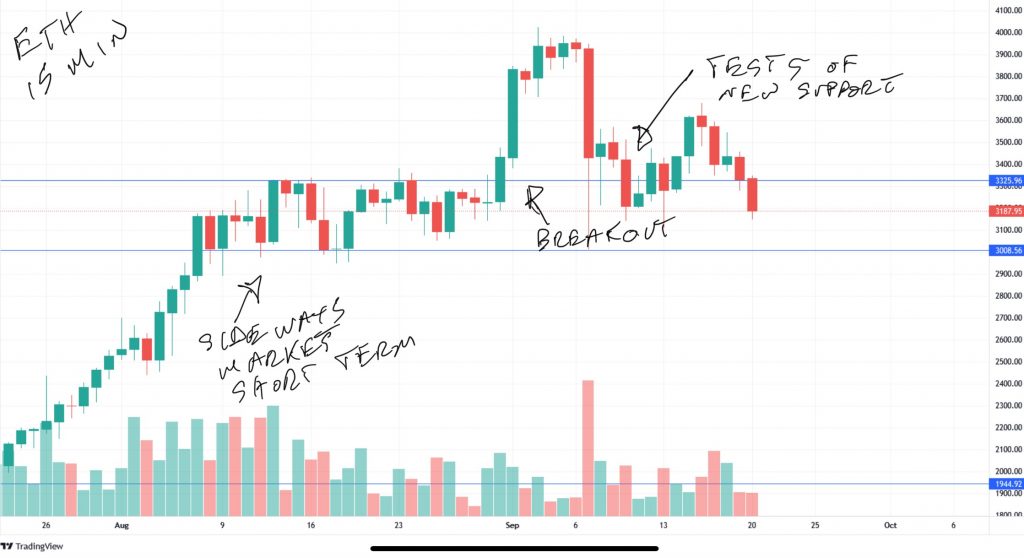
Looking at the 15 minute chart shows you one perspective.
Now back out to the big picture. Here are where those lines fall.
What support and resistance lines on the daily should you be aware of for your short term trading? Where could some inflection points be?
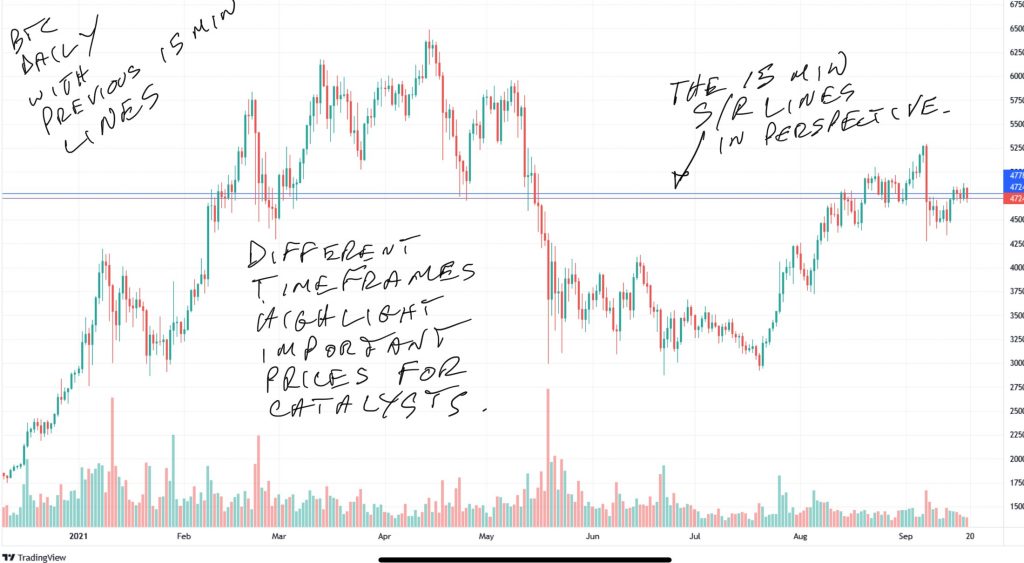
So as a BTC day trader, you might be focused on the 15-minute charts, but understanding longer-term charts will be beneficial.
You can look at monthly support and resistance and keep prices in mind where other traders may eventually be focused. These are places where traders will be interpreting the unfolding story.
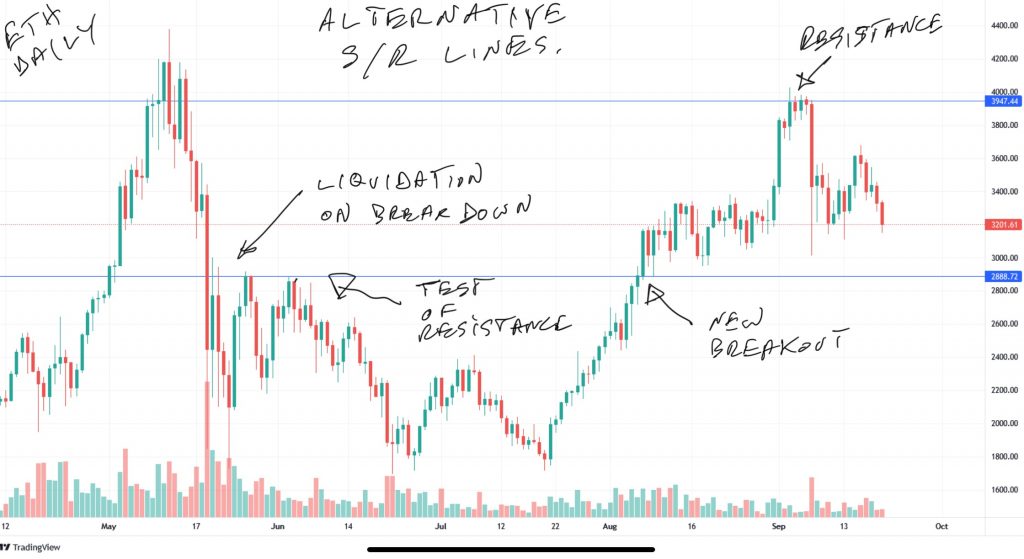
In a decline, that may be a bounce or a breakdown or a place to buy or lighten up. It might show you where to anticipate a liquidation trigger.
So while you may be focused on day trading Bitcoin or Ether on short-term patterns, these bigger-picture numbers can be helpful.
Technical support for crypto
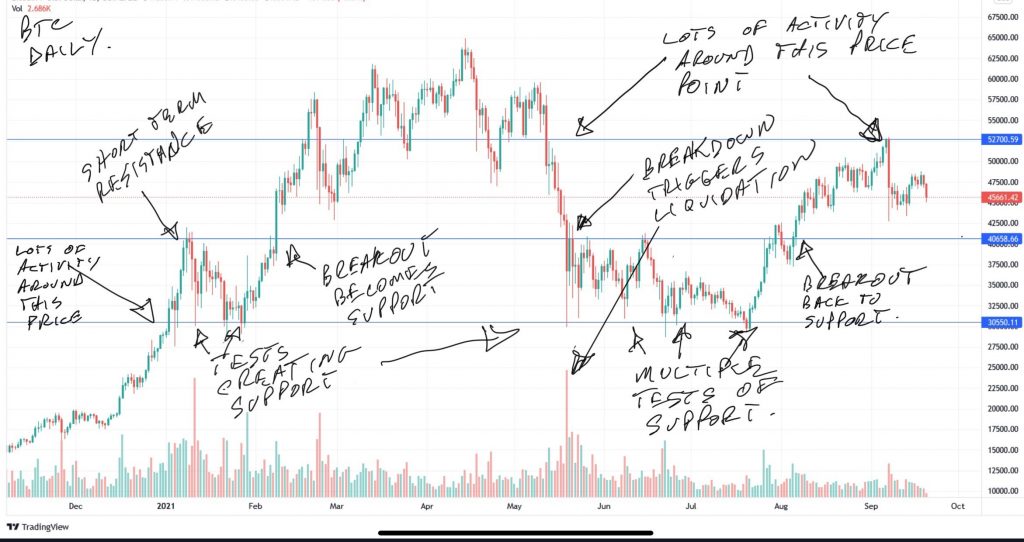
Support lines are places where an asset has traded down to repeatedly. So on BTC or ETH, for example, it will tend to be a horizontal line that touches around where these declines have reversed.
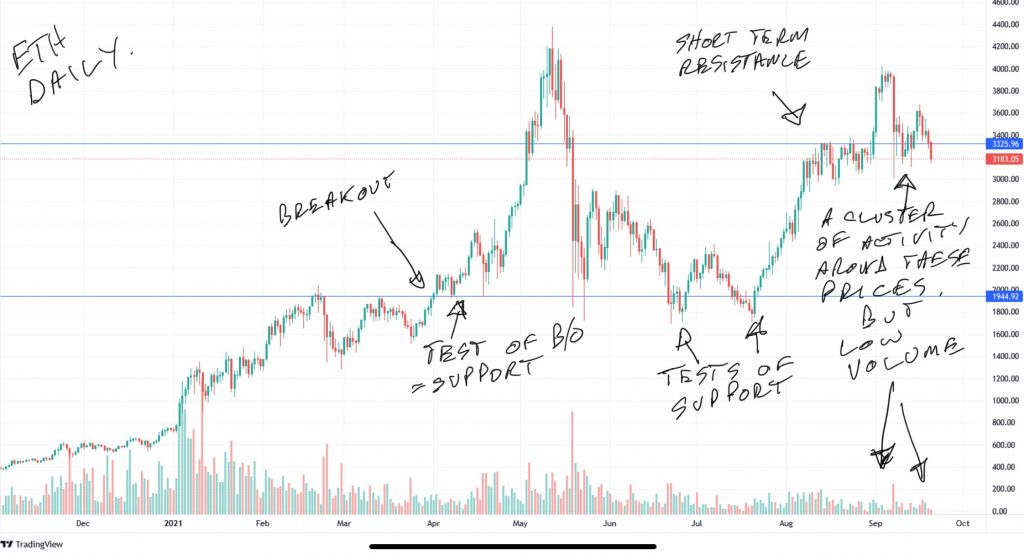
The more times the support line was touched, the stronger and more relevant it assumed to be.
But here’s the other part. Support lines are previously resistance lines. So support lines are technically a symbol of a previous breakout at some point.
Support lines will also represent an indicator of a breakdown under the right conditions. This happens when an asset blows through them on the downside.
Support is important because it will represent a place where buyers are comfortable buying dips. It also marks a reference point for stop-loss orders. Clusters of stops will accumulate just under long-standing support lines based on the perception of safety.
That perception grows the more times support is challenged and holds up.
Technical resistance for crypto
Resistance is the opposite of a support line in technical terms. It is the place where the upside movement of the asset seems capped.
It can mean that large sell orders are distributing at that level. Or the price is being used in another kind of trading strategy.
Resistance lines are often but not always former support lines. When an asset breaks down below a support line and fails to recover above it, it is called resistance.
In sideways markets, ETH, for example, is bracketed on the downside by support and the upside by resistance.
Resistance lines are important for recognizing breakouts and changes in trends.
Plus, in markets where short selling is common, it can be a spot for clusters of stop-buy orders.
How you can use these lines to trade Bitcoin, Ether and other crypto assets
Support and resistance lines are useful for developing trading plans and risk management.
You can use a particular support line as a place to enter trades in a market you think is bottoming out. Or you can use support to add back to your position in a sideways market.
You can also use it to reverse your position on breakdowns if you can use short sales.
You can plan ways to use breakdowns and stop-loss liquidations as a place to enter trades. That was covered in this article on leverage.
Resistance lines offer trading opportunities as well.
You can sell some of your position near resistance and buy it back at support. Or you can test the price looking for eventual breakouts.
And you can get faked out at these points as well. A breakout that doesn’t close about previous resistance is probably a fakeout. The same applies to an apparent breakdown that doesn’t conform with a close below the support line.
This takes us back to the psychology part I talked about at the beginning. You have to consider what everyone else believes the story is and how it will unfold.
Be prepared to take advantage of the inflection points
Using support and resistance lines while trading crypto is one way of keeping things simple. These are easy to use and open to a wide range of interpretations.
And because they are used widely, they will focus attention and activity.
That’s to your advantage.
Knowing where these lines are for Ether, Bitcoin, XRP or whatever you trade should be part of your plan. Because as we have seen, crypto-assets remain volatile and there are numerous prices where activity is concentrated.
People are getting rekt in leveraged BTC and ETH products all the time, causing liquidations. These provide unique trading opportunities for those who are prepared.
So take the time to evaluate these places on the evolving story you are participating in.
And remember there is no need to be perfect. Draw your own lines and conclusions about the prices they identify.
Then be one of the few crypto speculators prepared to profit from the evolving story at these inflection points.
_________________________
To put your technical analysis to the test, sign up for your Bitvo account below.
You can buy, sell and trade BTC, ETH, LTC and more on Bitvo’s secure, fast easy to use cryptocurrency trading platform.